How to Calculate Apple Search Ads ROAS with RevenueCat (And Why Most Developers Get It Wrong)
If you're running Apple Search Ads and using RevenueCat for subscription management, you're sitting on everything you need to calculate true ROAS. The problem is, most developers never connect the two properly — and end up optimizing based on installs instead of revenue.
This guide walks through exactly how to calculate Apple Search Ads ROAS using RevenueCat, what the numbers actually mean for subscription apps, and where the process breaks down at scale.
What ROAS Actually Means for a Subscription App
ROAS stands for Return on Ad Spend. The basic formula is straightforward:
ROAS = Revenue ÷ Ad Spend
If you spent $1,000 on Apple Search Ads and the users you acquired generated $1,200 in subscription revenue, your ROAS is 1.2x (or 120%).
But here's where subscription apps differ from one-time purchase apps: the revenue doesn't arrive all at once. A user who downloads your app today might trial for 7 days, convert to a monthly subscription, and renew 6 times over the next 6 months. Your true ROAS only becomes visible over time.
This is why you need to think about ROAS in time windows:
Day-7 ROAS — Did the trial convert? Is ad spend covered?
Day-30 ROAS — Did the first billing cycle renew?
Day-90 ROAS — Is this keyword actually profitable over a quarter?
Apple Search Ads shows you cost-per-install and taps. RevenueCat tracks your subscription lifecycle — trials, conversions, renewals, cancellations, and refunds. Put them together and you have what you need.
How to Calculate ROAS Manually Using RevenueCat + Apple Search Ads
Here's the process most developers use when they're doing this properly.
Step 1: Pull your spend data from Apple Search Ads
Log into your Apple Search Ads dashboard and export a campaign report. Note your total spend by campaign, date range, and keyword.
Step 2: Pull revenue attribution from RevenueCat
By default, RevenueCat labels revenue as "Organic" or "Unspecified." Before this step works, you'll need attribution set up — once it is, your campaigns will appear as a filter in RevenueCat Charts.
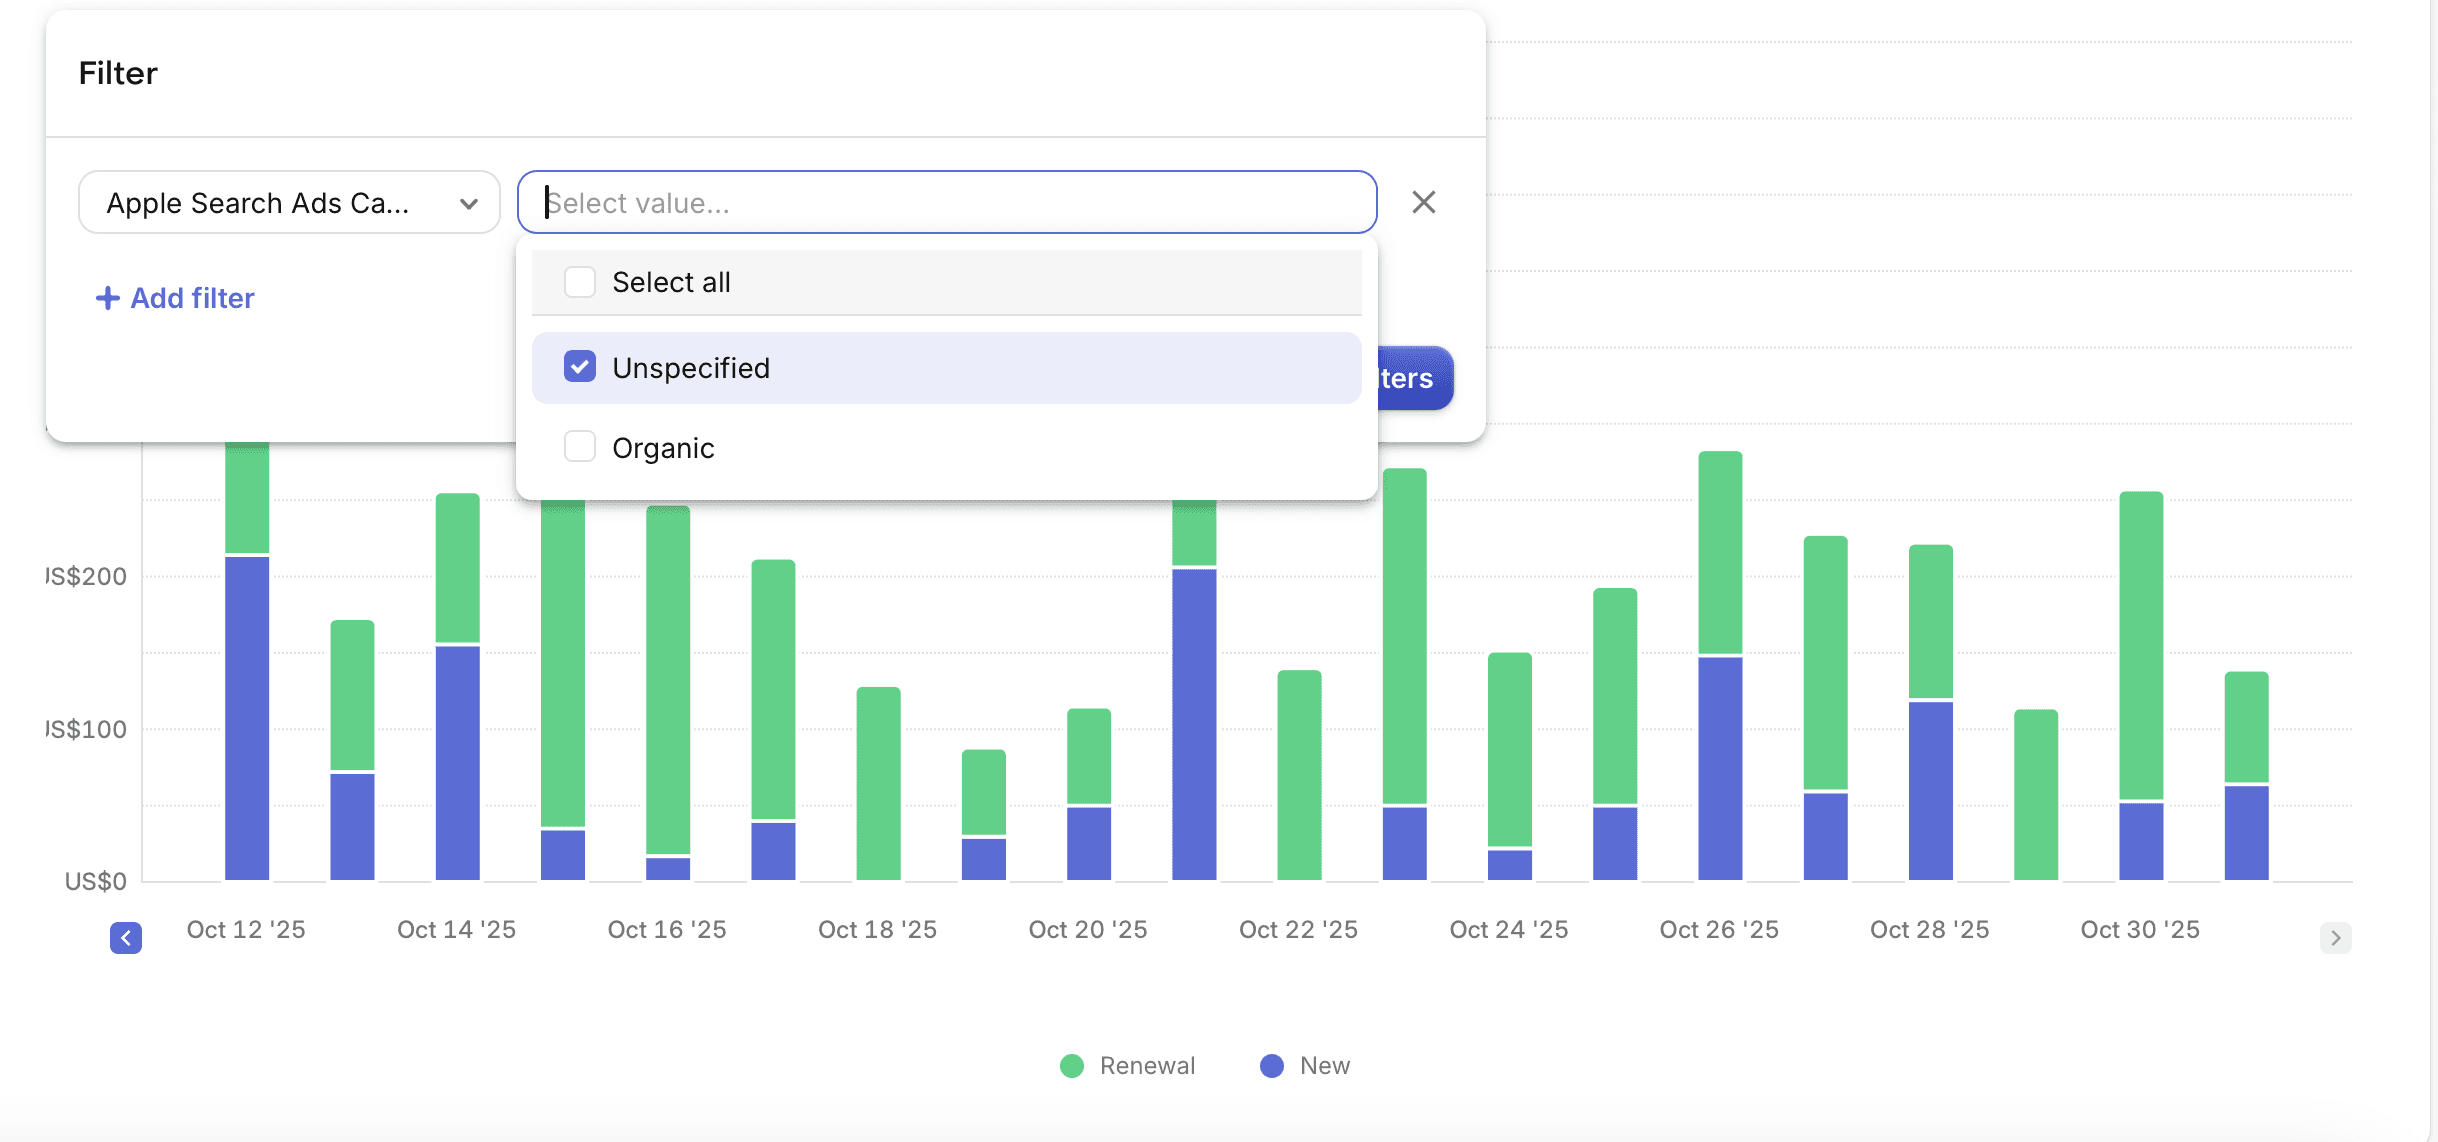
Filter your Revenue chart by your Apple Search Ads campaign and set the same date range as your spend export from Step 1. The number you see is the subscription revenue attributed to that campaign.
Step 3: Apply the ROAS formula
Example: $2,400 revenue ÷ $2,000 spend = 1.2x ROAS
One important detail on the time window: make sure you're looking at revenue generated by users acquired in your chosen date range — not all revenue that came in during that period. Total revenue mixes in renewals from users acquired months ago, which inflates the number and makes your current campaigns look better than they are. RevenueCat's cohort view handles this correctly.
Step 4: Repeat for each time window
Calculate your Day-7, Day-30, and Day-90 ROAS separately. A keyword might look unprofitable at Day-7 but become your best performer by Day-90 if renewal rates are strong.
The Renewal Revenue Factor Nobody Talks About
Here's something that changes how you should read your early ROAS numbers.
When you first launch an Apple Search Ads campaign, you're almost certainly ROAS negative. You're paying for installs, users are in free trial, and no subscription revenue has hit yet. Day-7 ROAS looks terrible. You might be tempted to kill the campaign.
But subscription apps have a delayed payoff that most ROAS calculations miss: renewal revenue.
Every user who converts from trial to paid and then renews — month after month — is generating revenue that traces back to the original keyword that acquired them. That renewal revenue is non-organic. It came from your ad spend. But it arrives weeks and months after the initial install, long after most developers have moved on to the next campaign.
What this means in practice:
A keyword that looks like 0.4x ROAS at Day-7 might be 1.2x by Day-90 purely from renewals stacking up
A campaign you were about to pause could be your most profitable one — you just can't see it yet
Conversely, a keyword with strong Day-7 numbers might churn heavily and never reach profitability
This is why the Day-7 / Day-30 / Day-90 windows matter so much. You're not just tracking one purchase — you're watching a cohort of users move through their subscription lifecycle over time.
The honest truth: not every keyword gets there. Some never cross into profitability no matter how long you wait. The renewal curve either climbs or it doesn't. But you can't know which is happening without tracking renewal revenue back to its source — which brings you right back to the keyword attribution problem.
Step 5: Do it again. And again.
Same export. Same date range matching. Same cohort filtering. Same formula. For every campaign, every week, across every country you're running in.
This is the part where most developers either give up on this level of optimization entirely, or spend their Sunday afternoons in spreadsheets instead of building their app.
That's the problem AppSkale solves — not a data problem, just the automation of work you'd otherwise do by hand.
The Hidden Problem With Campaign-Level Numbers
Here's what makes this worth doing even when it's painful: campaign-level ROAS hides what's actually happening inside your account.
Your overall campaign might show 1.47x ROAS and look healthy. But underneath, the numbers tell a completely different story.
Take this example from a meditation app running four keywords:
Keyword | Monthly Spend | Revenue (90-day) | ROAS |
|---|---|---|---|
meditation app | $400 | $180 | 0.45x |
sleep sounds | $300 | $690 | 2.3x |
anxiety relief | $200 | $540 | 2.7x |
mindfulness | $100 | $60 | 0.6x |
Total | $1,000 | $1,470 | 1.47x |
At a glance, 1.47x looks fine. Two keywords are losing money on every dollar spent. Two keywords are producing strong returns. The profitable ones are carrying the losers — and unless you do the keyword-level math, you'd never know.
The right move: pause "meditation app" and "mindfulness," reallocate $500 to "sleep sounds" and "anxiety relief." Same budget. Dramatically higher returns.
You cannot make this decision with campaign-level data alone. The only way to see it is to do the calculation per keyword — which brings you back to the spreadsheet.
Why This Breaks Down at Scale
The manual process works when you're small. It stops working when:
You're running 10+ active keywords
You have campaigns across multiple countries
You're optimizing weekly rather than monthly
Trial-to-subscription conversions happen days or weeks after the original install
At that point, by the time you've finished your spreadsheet, the data is already stale. You've spent the next week's budget on the same keywords that last week's analysis said to cut.
